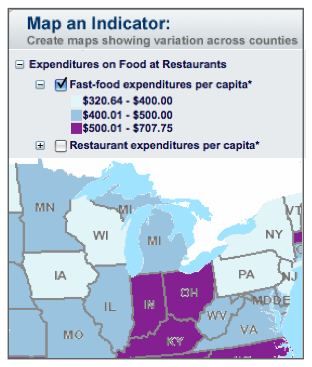
People in Indiana and Ohio spend more than $500 a year on fast food. That’s hundreds more than the average of the other Great Lakes states.
You can uncover this and other food-related information with a mashup created by the U.S. Department of Agriculture that compares food environments across the nation.
A community’s characteristics determine access to healthy food and physical activity. This mashup uses federal health statistics to illustrate how these characteristics affect lifestyle.
Users can click on a region to find its number of grocery stores, relative food prices and population. Check any of the indicators on the left to see those characteristics displayed on the map.
One indicator reflects availability of restaurants. Once checked, the map reveals how much the average individual spends on fast food.
There is even a measure of natural amenities that refers to a county’s distribution of landscape features like lakes and mountains. It’s included because environment plays a part in a person’s level of physical activity, according to the atlas.
A high score indicates an area with more natural amenities than the average.
Cook County in Minnesota has a score of 5 out of 7 for its location next to Lake Superior. Several Illinois and Indiana counties are also high on the list with scores of 4.
That’s because the Great Lakes are a source of recreation for Midwesterners, according to a report by the USDA’s Economic Research Service.
Warning: It takes time for the map to load.
