News of the centennial anniversary of the Great Lakes Storm of 1913 has been all over the region this year.

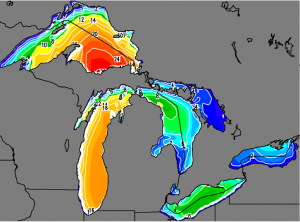
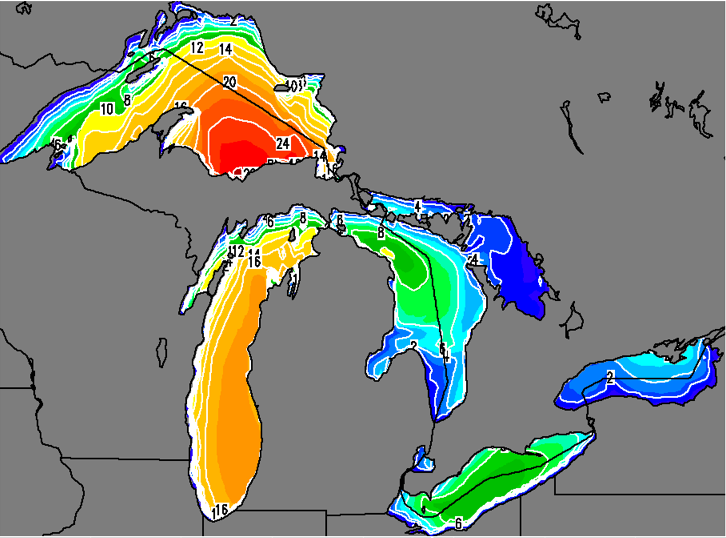
The simulation of the Great Lakes Storm of 1913 shows wave heights during the storm. Click the picture to see it in action. Image: National Oceanic and Atmospheric Administration
The storm sunk 12 boats and killed 250 people from Nov. 7 to Nov. 11. What would that storm have looked like if any of us had been alive 100 years ago?
The National Oceanic and Atmospheric Administration has an answer.
Since then our ability to predict weather has become much more proficient. But that’s not all. Meteorologists also have the ability to estimate historical atmospheric conditions.
The federal agency’s Great Lakes regional team and the National Weather Service’s Detroit team have built an animated map simulating the height of waves on each of the Great Lakes during the storm.
By clicking on the forward button on the right above the map, the simulation will start, beginning at 8:00 p.m. on November 8, 1913. Colors on the map change, coordinated with the key at the bottom, to show the maximum height of waves at a given time during the storm. Small numbers can also be found throughout the map, showing average wave heights in particular areas.
NOAA has also put together a page compiling history, facts and pictures relating to the storm.
The Storm of 1913 produced hurricane force winds and a maximum estimate of nearly 30-foot waves.
