Echo
Interactive lake monitoring tool to be updated
|
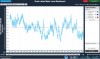
Data on rain, snowfall, ice cover and evaporation will soon be incorporated into a new online tool that shows Great Lakes water level fluctuations over the past 150 years. The Great Lakes Water Level Dashboard plots data on a graph that represents water levels of a lake the user designates. Users can even designate all of the Great Lakes at once to see their progression as a whole. But enhancements expected in as soon as a month will show rain, snowfall, evaporation and ice cover, said Anne Clites, a scientist on the project at the National Oceanic and Atmospheric Administration’s Great Lakes Environmental Research Laboratory. The tool was released in June to help researchers and answer the public’s questions about lake levels, she said.