Scientists are swapping topographic maps for satellite images as part of a new NASA mission to create the first global inventory of the Earth’s surface waters.

River width is depicted with shades of blue, with wider rivers appearing darker and thinner rivers appearing lighter. Image: NARWidth, NASA Earth Observatory
They recently finished compiling 1,756 satellites images of North American rivers and streams, including undocumented arctic areas north of the 60th parallel.
That work was done in preparation for the 2020 launch of the SWOT — Surface Water and Ocean Topography — satellite that will use information from those images to boost the accuracy of its observations of the length, width and elevation of rivers, lakes and oceans.
Meanwhile, scientists are excited about what they’ve already discovered.
“Twenty percent of the rivers we measured in the world were above 60 degrees north, but we previously had very little high-quality data for them,” said George Allen, a University of North Carolina hydrologist who’s building the international inventory of rivers.
The study of water and its movement is transitioning from a local to global scale, he said.
“From local science to climate modeling, scientists are looking at the whole [world], not the pieces, and remote sensing technology plays a big part.”
Advances in remote sensing technology allow scientists like Allen to more accurately map the landscape and its natural features, including those in uninhabited areas.
The first river map compiles 30 years of satellite images of the biggest rivers on the continent, including some of the widest stretches found along the Hudson and St. Lawrence rivers in the Great Lakes region.
To minimize the influence of seasonal changes of river widths, images were used when the water flow was at the annual average. Cloud and ice-free images were then passed through software that detects the center line and edges of a river.
“We stitched static images together to determine and map that average width,” Allen said.
The method, which favors satellite images over 3-D elevation models, provides a 30-year baseline to compare against images yet to be produced by SWOT.
River width is one of the most useful measurements for the SWOT mission, Allen said.
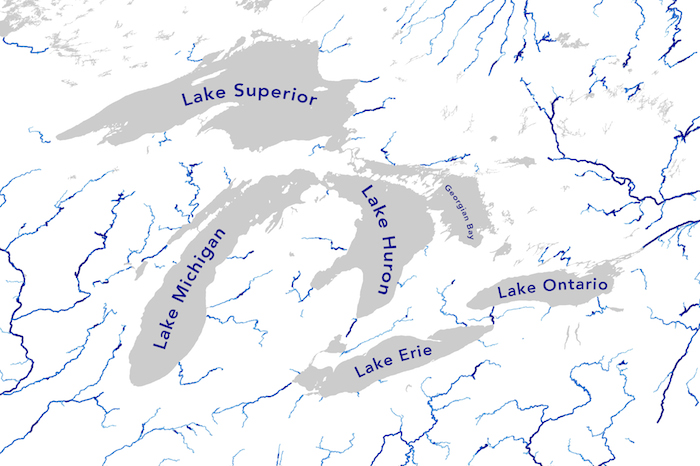
The widest river measured in the Great Lakes Region is almost 22,000 feet on the St. Lawrence River downstream of Lake Ontario. Image: George Allen, NARWidth
Rivers more than 100 feet wide were measured and mapped.
“To reduce bias, we were only able to include the very largest rivers in our analysis, but we did notice a nice statistical distribution of river widths,” Allen said. “There are a lot more narrow rivers than wide ones.”
Narrower rivers and streams require on-the-ground observation and measurement, said Allen, who’s leading another study to fill in that data gap.
Width is important because it determines the surface area of rivers. And that helps scientists study greenhouse gas emissions, floods and other landscape changes.
The new surface area measurements can be used to quantify greenhouse gas emissions, Allen said. But it “creates a real interesting problem.”
The new estimate is larger than ever, making rivers and streams — which emit greenhouse gases — a greater contributor to global warming.
Knowing the river width can help with the front end of a lot of research, he said.
“It’s already being used to predict the location and extent of floods, and it can be used to see how the landscapes change over time, what drives the placement of lakes, rivers and mountains and how fast they’re growing or eroding.”
In the Great Lakes basin, river widths are difficult to predict because the region once had glaciers that actually carved the landscape, Allen said. Unlike elsewhere, the rivers were not self-forming.
Future maps — including the global river map to be released in 2016 — will improve width and location estimates, providing more accurate data to compare against the upcoming SWOT satellite measurements.
“This is a new science, a starting point, and we’re continually getting closer estimates,” he said.
All project data is available online.